iSchool Capstone

2016

Project Logo

The Digital Protagonist Research Toolkit - Team Datavores

Video games are widely consumed as interactive media by a diverse population. 49% of US adults reportedly play video games and the US industry alone is estimated to be worth over $23 billion. However, who gets represented in video games is poorly understood and public discussions on the topic are divisive and heavily anecdotal. Controversies like Gamergate demonstrate a lack of depth, rigor, and scope in discourse on diversity in gaming across stakeholders including academics, consumers, developers, and publishers. Our team identified and built solutions to address the two largest barriers to the study of representation in gaming: a standard way to describe video game protagonists and a representative sample of video games. Released in a public-friendly format in collaboration with key stakeholders (e.g., the GAMER group, Anita Sarkeesian), these materials enable the systematic study of representation we need to advance crucial dialogues about our fastest growing media.
Project Logo

The Route Assessor

The shortest distance between two points is a straight line. But when it comes to moving freight, that line becomes complex. In these uncertain times of political upheaval, natural disasters and huge amount of freight theft, Route Assessor aims to empower Expeditors in choosing better delivery routes based on various risk parameters. This robust web based solution helps Expeditors in recommending the best route to the customer, so that risk can be intelligently and appropriately managed. A real time risk score is calculated for a given source and destination, based on FBI crime data, Freightwatch data, weather and commodity type. With Route Assessor, Expeditors can provide a holistic risk assessment of customer’s shipment by helping them to choose better risk mitigation products and provide a superior quality of service compared to its competitors. Route Assessor reduces the probability of an “unwanted surprise” within the supply chain logistic.
Project Logo

Vision Screener

One in four children worldwide is affected by eye disease, and because nearly half of parents in the US with children under age 12 have never taken them to an eye care professional, many critical vision abnormalities go unnoticed. However, if caught early on, about 80% of cases can be resolved, preventing lifelong vision problems. Our Android application, Vision Screener, was created to bridge this gap and assist parents in determining if their child is at risk of eye disease. A parent can simply take an up-close picture of their child as instructed, and the app will analyze it instantaneously. If results indicate a risk of disease, the app helps parents find a nearby eye care professional for further diagnosis. Through this application, we hope to increase early detection of eye disease so more cases can be treated. If you could save a child’s sight by taking a picture, wouldn’t you?
Project Logo

Vision Zero Dashboard & Interactive Map Tool

As part of Seattle’s ongoing mission to improve traffic safety, the Seattle Department of Transportation adopted the initiative Vision Zero, a plan to end traffic-related deaths and serious injuries by 2030. While Vision Zero’s progress is closely monitored internally by SDOT and other government officials, there is currently a lack of data made available to the general public. Our Capstone project aims to solve this problem. Our solution is composed of an information-driven dashboard that shows Seattle’s high-level traffic collision trends as well as an interactive map tool that allows users to view aggregated and individual collisions with specific collision details. It is our hope that the information presented by our project will not only provide traffic enthusiasts the necessary data they desire but also inform Seattleites on traffic statistics so they can become safer commuters. With everyone’s help, we can reach our goal by 2030 and Seattle can truly live up to being one of the safest cities in the country.

2015

Project Logo

Advertising Budget Recommendation Model

94% of consumers research cars online before purchasing, and about a third willing to buy a car online. CDK Global’ s digital advertising department makes online marketing easy for vehicle dealers by budgeting and handling digital advertisement to increase customer reach and sales. We have focused on improving their budgeting process with an efficient and accurate model that improves transparency and customer satisfaction. We used predictive analysis to develop a model using Google AdWords, market demand and vehicle sales data for a particular Marketing Area to give a sophisticated budget proposal. This model will give insight into the top selling car models for a dealer and the amount of dollars the dealer needs to spend to advertise those models. The Advertising Analysts will be able to use this model to derive detailed performance of a client in a quicker and precise fashion, increasing the overall efficiency of the budgeting process.
Project Logo

Coordinate

Nowadays, nobody’s schedule is the same and a significant amount of time is wasted trying to find common openings for group meetings. While there have been other services created to try and address this problem, they have major issues including poor user interface and a lengthy data entry process. Coordinate was created by our team to solve this problem and address the critical flaws in the existing tools. Coordinate is an online scheduling platform that allows users to quickly organize schedules together to find meeting times for the entire group. After receiving a link from the host, all a user needs to do is use our click-and-drag entry calendar to indicate their availability and our system will identify the optimal time for the group to meet. By simplifying event scheduling, we hope to allow the groups to have more time to improve their event, rather than wasting it comparing schedules.
Project Logo

Corelytics: Data Analysis of Small IT Businesses

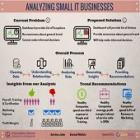
Corelytics provides more than 135 small IT service businesses’ with a financial management tool that helps these businesses maintain an automated account keeping system. The tool, through data analysis algorithms, analyzes and flags transactions that misalign with businesses’ financial goals. Executives use the tool’s dashboard to cut data noise and determine “WHAT” aspects of financial data needs attention for improving revenue to expense ratio. However, these smaller businesses lack resources to analyze and determine how to improve key financial pivots. Wouldn’t it be great if businesses could see financial data trends of healthy companies within their industry? Our project aims on delivering this exact solution by analyzing all hosted financial data in a specific industry. We want to provide financially weaker businesses with healthy trends in their industry via the tool’s dashboard. This will help them determine the “HOW” of improving revenue to expense ratio so that Corelytics can stay true to its commitment of enabling “BETTER BUSINESS DECISIONS”.
Project Logo

Coursector: A UW course discovery and comparison tool

Finding the right courses every quarter is a challenge for undergraduate Huskies. To evaluate prospective courses, students depend on information resources that are often incomplete or unreliable. Coursector is an application that helps undergraduates find, compare, and select classes that best fit their academic goals and interests. Drawing from over 200,000 unique records of UW transcript data, our application provides students with personalized recommendations, to quickly narrow their course search, and clear visualization of how courses compare by workload, teaching quality, average student grades, and class demographics. Coursector makes it easy to compare course offerings side-by-side, including the same course taught by multiple professors. With Coursector, finding the perfect course is easier than ever.
Project Logo

Data visualization of Financial data

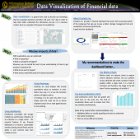
CoreConnex Incorporated is a business data analysis company that produced information visualization through its subsidiary company Corelytics. The data visualization market has shifted from classic platforms such as charts and static graphs. In today’s fast paced information economy, many visualization tools are available to increase the potential for profit. Therefore, Corelytics has propagated its own dashboard to perform data analysis that outputs the results of analysis in the form of basic visualizations like charts and graphs. As such, this project was motivated by Corelytics’ question, “What are some of the innovative techniques to visualize financial data?” To address that query, this project created visualizations of Corelytics output using non-Corelytics dashboards. Based on the results, this project will make recommendations on which techniques the company may adopt to increase potential of their overall visualization experience.
Project Logo

Dawg Data

Title: UW Athletics CRM Project Description: The University of Washington (UW) Athletics department has long been seeking a tool that has the ability to store and filter all of the data that they collect at various sporting events. Our solution is a Customer Relationship Management (CRM) system that the UW Athletics marketing department/analysts can use to increase sales on game day. Examples of searches that users will be able to conduct include: fans that have used the WiFi, fans that live in Bellevue, and fans that have been season ticket holders for 10 years. Our project will make a difference in the UW Athletics department by being able to conduct targeted searches on fans. The athletics department will have information on every fan that has ever been to a sporting event at the UW. By having access to this information, it will make the customer data more transparent and thus increase sales for the department. Team Members: Kevin Le and Mitchell Klein Program: Informatics