iSchool Capstone

2015

Project Logo

Measuring Financial Health of Non-Profits: A Data Analysis Initiative with Corelytics

If non-profits were able to analyze their financial data and predict future trends, would they know whether they are on the road to fiscal health or financial failure? Using historical accounting data on non-profit organizations from the Corelytics financial dashboard, we undertook an observational study that identifies key indicators of financial health in non-profits. A novel ranking system was created through appraising each non-profit on key metrics identified and weighted through qualitative research conducted using interviews with industry experts. We provide recommendations to Corelytics on how they can improve their services to non-profit clients, and to non-profits on how to better use Corelytics to track key financial health metrics. The services provided by these non-profits to the communities they reach out to can ultimately be improved through this informed and scientific approach to tracking their fiscal health.
Project Logo

Pricing Optimization Project for Test Innovators

Students nowadays are facing tremendous competition and pressure while applying for higher education. One of the most difficult parts is preparing for the tests. Test Innovators focus on promising the students with a brighter future by providing preparation online tests for different exams. Although the company has thrived in the business, it could maximize the profit by executing different pricing strategies. Combining lore in machine learning and business, our team conducts several experiments on the websites to observe the behavior of users, including free trial demo, subscription pricing and website A-B testing. We collect both user behavior and transaction data to perform analysis helping the business to grow its customer base and maximize revenue per capita simultaneously. Our work not only benefits the business, but also helps the students to have a prosperous future by increasing their chance to be admitted to an ivy-league college.
Project Logo

Prizmiq Analytics

To help online retailers understand how customers are interacting with their products, we created Prizmiq Analytics. Prizmiq, a startup based in Seattle, is paving the way for 3D product experiences on the web by providing scanning and hosting solutions for 3D product models. Prizmiq Analytics records online-user interactions with 3D models and provides a visual dashboard that helps deliver and display the most important information to retailers. The analytics dashboard will help provide information like how long users are interacting with a product or what color of a product users like the most. Also, for the first time, we are allowing retailers to see how their users are moving in 3D space with interactive 3D visualizations. This will enable retailers to understand their customers’ behavior, the successes and failures of a certain product’s design, and how to make the product better.
Project Logo

Studying Phytoplankton Trends in Oceans Using Data Science

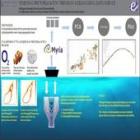
Discovering Phytoplankton Trends in Oceans Using Data Science Abhigyan Kaustubh (Full Time MSIM) Elton Dias (Full Time MSIM) Tanmay Modak (Full Time MSIM) Phytoplanktons are an important part of marine ecosystems, producing nearly half of the world’s oxygen supply by consuming carbon dioxide through photosynthesis. Marine biologists find it difficult to exhaustively study habitats of phytoplankton as it is nearly impossible to draw discrete samples of water from large water bodies. We plan a novel technique of analysing multidimensional flow cytometry data collected by an oceanic cruise at regular time intervals and then use suitable clustering techniques to identify regions in the water body that have similar trends in phytoplankton population. We then plan to make inferences by correlating our findings with environmental factors like temperature and salinity. This is a unique approach and through our findings, we hope to lay the foundation for oceanographers and environmental researchers to conduct further research in marine habitats using data science
Project Logo

TuneBI: Mobile Marketing Visualization

TuneBI: Mobile Marketing Visualization Fei Guo, Yanling Hu, Xiaojuan Wu, Jun Fan (Full-Time MSIM) Sophisticated marketers use TUNE BI (Business Intelligence) to extend their analytics capabilities without the traditional time, expenses, and risk of developing their own business intelligence platform. We worked with TUNE, one of the best mobile applications tracking company in the world, to develop and enhance the visualization experiences of the new TUNE BI services. The new TUNE BI dashboards consist of many Key Performance Indicators such as Return on Investment per Ad campaign and publisher, Average Revenue Per User and Cost of New User Acquisition, and many more. TUNE BI dashboards take out the hassle of understanding analytics, and help marketers and executives to focus on making quick and effective decisions.
Project Logo

Wikitree

Wikitree is a web application built to help undergraduates with their research. Wikitree tracks and organizes the user’s browsing history through Wikipedia articles. Wikitree is unique because it emphasizes mental connections the user makes on their journey. Wikitree aims to stay adaptable for each individual’s research goals. Our research and user testing revealed many struggles. Undergraduates struggle to dive deep into one topic while staying aware of the big picture. They struggle to mentally categorize connections between different topics during early stages of research. They struggle with feeling overwhelmed by the amount of material encountered, and finding a clear vision within. Wikitree acts as an aid for the user in tracking their explorations. The visualization helps users maintain a high level overview, preventing them from feeling overwhelmed, getting sidetracked, or losing sight of their goals. Special thanks: Mike Freeman, Jeffrey Heer, Jessica Hullman, David McDonald, David Stearns, and Jevin West.
Project Logo

WWU Financial Aid Website Redesign

The financial aid process is full of esoteric rules and regulations. Students on financial aid, who are considering dropping a class, must navigate a complex process. Without realizing it, students can inadvertently set off a chain of events that can jeopardize their ability to continue to attend college. Our tool guides students through this complexity by tailoring a series of questions to fit their situation. Easy to navigate and available to explore, our tool empowers students to investigate the consequences of their decisions. We want students to understand how they might be impacted by financial aid details and what they can do about it. In addition, to improve the overall findability of the financial aid website, we designed an improved navigational framework that allows students to quickly find answers to questions without having to contact the financial aid office. We're excited to show you how our work has brought a touch of simplicity to a complex situation.
Project Logo

Zip Code Manager

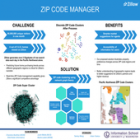
Zillow is an online real-estate service that offers renters and homeowners a variety of information surrounding property availability and pricing. Boasting data on over 100 million homes, Zillow is currently one of the largest online real-estate companies in the world. Predicting future home purchasing trends across different geographic regions is critical for Zillow’s success in meeting the shifting needs and interests of its consumers. Using insight derived from user search behavior on the Zillow platform, we created a clustering algorithm that provides Zillow’s data analytics team with a continuous snapshot of relevant, accurate trends in how users’ property preferences change or remain similar across zip code regions and time. Our insight into renter and homeowner search behavior enables Zillow to better predict the interests of its consumers; make smarter market suggestions to existing Zillow real estate partners; and gain a competitive edge in the real-estate information business.

2014

Project Logo

“Is Your Refrigerator Running?” Device Monitoring System Dashboard

CenturyLink Arena is responsible for maintaining over a hundred refrigerators to keep products fresh for their customers. Every broken fridge costs CenturyLink more than $1000 in replacement parts and products. Existing Device Monitoring Systems (DMSs) can be used to track fridge failures, but are difficult to navigate and require data analysis training to use. Web 10.0 has teamed with Seattle startup Ombitron Inc. to create a new platform-as-service DMS to solve these issues. Ombitron hardware detects a variety of critical metrics about a device, then Web 10.0’s Dashboard interface delivers this information to users in a streamlined and visually appealing style for at-a-glance notification. Detailed metrics and time graphs are also available for each device to track history and changes in performance. This Dashboard will be adapted to suit a wide range of devices, and is currently being considered for use by multiple companies.
Project Logo

Alaska Airlines Carry-On Bag Predictive Analysis

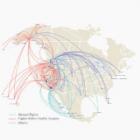
After Oct. 30th, 2013, Alaska Airlines began to charge passengers $25 each for the first and second checked bags, so a lot more passengers started to carry their bags on the flight. Since then passengers constantly experienced flight delay due to the fact that too many carry-on bags cannot be stowed in the limited overhead bins. If the approximate number of “problematic” carry-on bags of each flight can be known in advance, Alaska Airline can prepare much earlier to avoid flight delay. Based on the flight and baggage data from August 2013 to February 2014, our project right there to help solve this problem. We identify several interesting patterns from the data, like the flights to Canada have more “problematic” carry-on bags than others, and furthermore we design a statistic model for predicting the approximate number of bags which should be claimed at the gate to avoid the delay problem.