iSchool Capstone

2014

Project Logo

People's Movement and Migration Pattern Using Call Detail Records

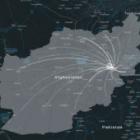
The Bill and Melinda Gates foundation, interested in solving education or welfare related problems in developing countries, is looking for the solutions that could better gauge the demography of a country. Lack of any concrete census data from Afghanistan can be substituted by tracking migration patterns of people through Call Detail Records (CDR) from cellular subscribers. We came up with a framework to visualize short-term movement over long distance and long-term migration patterns of people based on CDR, and to correlate these patterns. We track inter-provincial migration and how it is varies in response to Geopolitical events like Bomb-blasts, Flood, and Snowfall. CDR data is also supplemented with complementary data from airtime top up activity to account for socioeconomic factors of the subscriber.
Project Logo

Predictive Analytics for Pilot Productivity

Alaska Airlines, the 7th largest passenger airline in the US, employs around 1400 pilots and first officers. It requires extensive planning and forecasting to plan for flight trips by accommodating varying schedules of the pilots. Over- or under-estimation of pilot’s flying time impacts the overall costs, and it needs to be utilized efficiently as hiring pilots is expensive. After extensive research we came up with a solution in the form of a predictive analytics algorithm. It considers the pilot’s historical data comprising of variables such as vacation and training hours, and helps in predicting the open flying time for the pilots. This solution will automate the process of calculating open flying time and will assist the team at Alaska to prepare pilot’s monthly schedule in advance. The nearly accurate estimation will lead to elimination of superfluous costs resulting from over/under estimation of open flying time and will ultimately lead to heightened pilot productivity.
Project Logo

Preparing for Standardized Testing

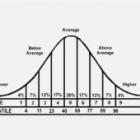
Our client, Test Innovators, provides practice curriculums for the Independent School Entrance Exam (ISEE) in an effort to address the gap in resources for adequate preparation. The biggest issue holding them back from success was a process that analyzed the standardized grading system which would give them insightful information to use and relay to their users. We tackled this problem by performing data cleansing, modeling, and analysis on data sets provided by the client which was collected from students who had already taken their practice exams. To gauge success and effectiveness, our user’s scores will be 10% higher than non-Test Innovator users and our system will also provide grade predictability within one grade level since the stanine grading scale ranges from level one to level nine. With this ISEE grading analysis process, we provide high levels of confidence and preparation for our client’s users in their test-taking careers.
Project Logo

SYM Reporting System for Helping Homeless Youth

The National Runaway Switchboard estimates that on any given night there are approximately 1.3 million homeless youth living unsupervised on the streets, in abandoned buildings, with friends or with strangers. At the same time, general statistical software is usually unaffordable for non-profit youth caring organizations. Finally, lack of person-focused statistics makes it hard to provide person-focused caring. The SYM reporting system was developed to help Street Youth Ministries by providing an overall view of activities, generating impact reports to sponsors, and detecting the young people who need immediate care, thus hugely improving the efficiency of resource allocation.
Project Logo

YouCook

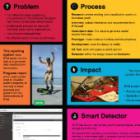
YouTube Cooking Shows (YTCS) want to interact with their users and know who is using their instructions to cook in real life. YTCS cannot get this information through YouTube’s default user engagement methods such as total views, comments, liking, and subscribing. We designed a YouTube app called YouCook that gives users recipe suggestions, a cookbook, a meal plan, and a grocery list. YouCook records and analyzes user data and provides YTCS with metrics to measure what their viewers are cooking. YouCook bridges an information gap: user’s will be able to have cooking resources in one convenient location, and YTCS will have more data and analysis that will allow them to cater to their user’s needs by providing user-centered content based on user’s interests.

2013

Project Logo

Alaska Airlines: Flight Attendant Productivity Tool

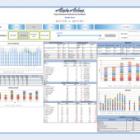
Alaska Airlines is a major commercial airline based in Seattle, Washington. They employ approximately 3,000 flight attendants who provide direction and assistance on flights within North America. A daily focus on flight attendant scheduling and productivity metrics is necessary to effectively manage airline costs, minimize operational delays, and forecast future productivity to generate revenue and maintain market share. The interactive Flight Attendant Productivity Tool prototype we developed packages scheduling and productivity metrics in a clean and in-depth decision-making format. The tool provides Alaska Airlines management with continuous access to relevant and accurate staffing data and productivity metrics to monitor flight attendant productivity and forecast staffing needs. It enables Alaska Airlines to maintain efficient airline operation and to remain competitive in the airline business.
Project Logo

Big History on ChronoZoom

Visualizing the enormous timescales associated with cosmic events is problematic, especially when juxtaposed with the relatively short amount of time humanity has existed. Instructors of Big History, an interdisciplinary approach to understanding how the forces that shaped the universe relate to and drive modern events, are looking for ways to overcome this challenge. ChronoZoom, an online, open-source technology, seeks to address the issues associated with viewing massive timescales by allowing the creation of infinitely zoomable timelines. With sponsorship from Microsoft Research Connections, we created content within ChronoZoom describing events, data and discoveries relating to the history of energy and climate. This content is intended for use by the Big History class at Lakeside Upper School. Our project allows students to interact with Big History content in a fun, intuitive and informative way. Helping them to appreciate human history in the context of the larger events that shaped our universe.
Project Logo

BLAST! The Boeing Library Automated Statistics Tool

The Boeing Company Library was among the first corporate libraries to institute an online chat reference service, known as Ask-A-Librarian. The Boeing Library Automated Statistics Tool (BLAST!) is a custom-built, database-driven dashboard for displaying real-time, visualized metrics about the Ask-A-Librarian service. BLAST replaces error-prone data manipulation and inefficient, time-consuming data analysis with instantaneous, attractive graphs for quickly assessing operations. This business-intelligence tool utilizes the best, non-proprietary code libraries and standards, and was created especially by yours truly to be scalable to other library services. The countdown to performance optimization has begun: 3, 2, 1 … BLAST off!
Project Logo

Canadian Environmental Health Atlas: Visualizing the Link Between Air Quality and Mortality

80% of the world’s population breathes air that is unhealthy. Airborne pollutants from human activities contribute to at least 7% of premature deaths worldwide, primarily from cardiovascular disease. Public awareness about these risks is remarkably limited. Despite efforts to disseminate data about air quality and decades of research correlating pollution and mortality, informational tools that demonstrate the relationship between air and health in an accessible, straightforward manner are scarce. The Canadian Environmental Health Atlas aims to educate and empower citizens and policy makers by revealing the links between environmental toxicants and diminished health. Our contribution to the Atlas is a data visualization that brings to life the relative risks to human health from polluted air. Using estimates of airborne particulate matter derived from satellite imagery, we join air quality measurements and mortality statistics in a geo-spatial format. Our goal is to present complex science through a comprehensible, interactive visual experience.
Project Logo

ChronoZoom in the Classroom

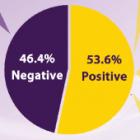
ChronoZoom is an interactive online time visualization tool dedicated to help envision the temporal relationships between events throughout history and across disciplines. The ChronoZoom team believes this visualization would be very useful for education, and so wants for the tool to be used in schools. However, there have been no prior test cases into how ChronoZoom actually performs in a classroom. Our project addresses this problem by helping two courses at the UW to integrate ChronoZoom into their curriculum. We then analyzed its impact through surveys, interviews, focus groups and class observations. Through our research, we provide recommendations on how the tool needs to be improved to accommodate the environment of a college classroom, and whether or not it is worthwhile for a university to adopt the technology based on student and instructor experiences.