Data visualization of Financial data

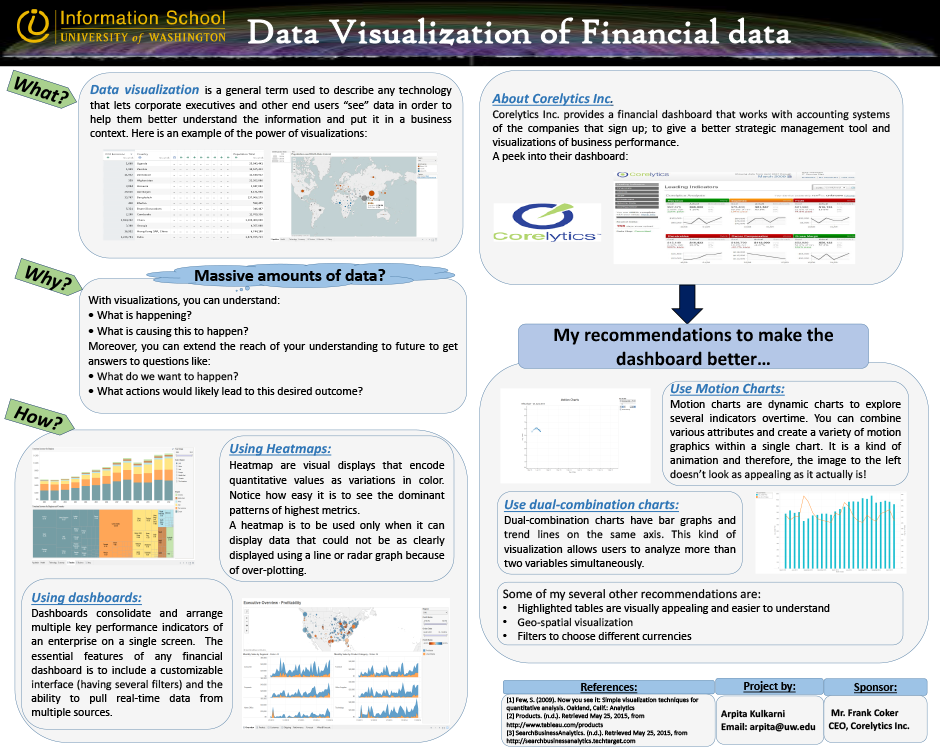
CoreConnex Incorporated is a business data analysis company that produced information visualization through its subsidiary company Corelytics. The data visualization market has shifted from classic platforms such as charts and static graphs. In today’s fast paced information economy, many visualization tools are available to increase the potential for profit. Therefore, Corelytics has propagated its own dashboard to perform data analysis that outputs the results of analysis in the form of basic visualizations like charts and graphs. As such, this project was motivated by Corelytics’ question, “What are some of the innovative techniques to visualize financial data?” To address that query, this project created visualizations of Corelytics output using non-Corelytics dashboards. Based on the results, this project will make recommendations on which techniques the company may adopt to increase potential of their overall visualization experience.
Arpita Kulkarni
MSIM
