iSchool Capstone

2018

Project Logo

Collection Assessment, Ebooks vs. Print Books: Usage by patron, format, and subject area within the context of Alliance resource sharing

The Clark Library serves over 5,000 patrons at the University of Portland. I conducted a collection assessment to understand user behavior and determine areas of growth for ebook resources. I compared usage of ebooks and print books by subject area using ILS data, consortium reports, and vendor reports. The assessment revealed valuable relationships between format preference, users, and subjects, especially in the humanities disciplines. The strengths and weaknesses of each subject area and format will inform collection development decisions for future budget years and will benefit the library patrons by more closely meeting their research demands.
Project Logo

Community Health Indicators: A Design Approach

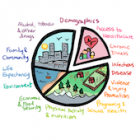
The Public Health Department of Seattle and King County maintains a comprehensive collection of data called the Community Health Indicators (CHI) dataset. These indicators aim to measure health behaviors, health outcomes and demographics of King County residents. The CHI online data portal draws in a broad range of users, including researchers, nonprofits, policy-makers and concerned citizens. However, some users had difficulties navigating and understanding this website. Our team utilized a user-centered design approach to create a three-part solution to tackle these problems. Our solutions include: 1) information reorganization and search functionality, 2) video tutorials, and 3) data visualizations.
Project Logo

Connecting Communities: User Research and Redesign of a Tool for Local Broadband Planning

We redesigned a tool, called the Broadband Connectivity Assessment, which supports advocacy for high-speed internet access in underserved communities in the US. We conducted user research and interviewed participants who piloted of a beta version of the tool. While responses were overwhelmingly positive, there were challenges which made the tool difficult to use. We offer solutions through a redesign of the user experience and architecture of the tool. Because the needs of participants vary, our final design recommendations focus on creating a tool that is flexible and can be adapted to the needs of any community.
Project Logo

Connecting Historical Materials to Each Other and the World: Creating Finding Aids for UW Special Collections

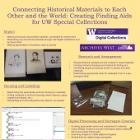
For my capstone project, I processed and created finding aids for five visual materials collections from UW Special Collections. As a result of this project, materials that were previously inaccessible to researchers are now contextualized and fully searchable through Archives West and UW Digital Collections. Multiple steps had to be taken in order to make the materials accessible: researching and arranging materials, housing materials in appropriate archival housings, encoding materials using the XML publishing program XMetaL Author, scanning images and creating digital surrogates, and revising finding aids based on the feedback of UW’s Visual Materials Curator Nicolette Bromberg.
Project Logo

Data For Criminal Justice

The Prosecuting Attorney’s Office prosecutes all felonies in King County. Their decisions are based on experience but minimal statistics. With increased complexity in crimes and rising need to analyze data from multiple law enforcement agencies, we collaborated with their Firearms Violence department and developed an infrastructure to analyze criminal data. The prosecutors got a better understanding of the trends across key metrics. Now, they can analyze bullet casings to link different incidents, extract an individual’s historical criminal involvement and work with law enforcement agencies to increase referral rate, thereby, improving the sponsor's overall data literacy.
Project Logo

Data Visualization: Global Funding for Chronic Non-communicable Diseases

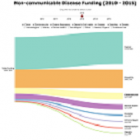
Chronic non-communicable diseases, such as cancer and diabetes, are responsible for over 60% of worldwide deaths annually, and 80% of those occur in developing countries. Yet, only 1% of global health funds are aimed at addressing this group of diseases. According to our sponsor, RTI International, while there is ample data documenting inadequate funding, a lack of effective data visualization inhibits activists from spotlighting this issue. Our project turns data into a captivating set of graphics that tell the story of inadequate funding to reduce chronic non-communicable diseases in developing countries, helping RTI make a stronger case for more funding.
Project Logo

DataBot

Do you love your work, but have this roadblock called “SQL” you don’t have the time to learn? Our product, DataBot, seamlessly bridges the gap between business and technology, so that you can focus on scaling new heights. DataBot leverages Machine Learning to transform natural language into SQL and presents actionable information. This empowers consultants to retrieve data on the fly, and eliminates ad hoc requests to analysts. DataBot harnesses the power of the cloud to ensure zero downtime. Slack integration ensures it can be easily deployed in an office environment. Embrace yourselves for the next disruptive technology revolution!
Project Logo

Developing and Presenting Spanish Story Times by Non-Spanish-Speakers

The responsibility for Spanish story times at Provo City Library has rested on one native Spanish-speaking storyteller for many years. To ensure the ability to provide continuing Spanish programs, the Children’s Services Manager desires to expand Spanish programming staff to also include non-Spanish-speaking librarians. I therefore researched best practices for story times, observed bilingual programs at nearby libraries, and created a set of bilingual story time scripts for use by non-Spanish-speaking librarians. This will make a difference for the city’s Hispanic and Latino population who will gain confidence in the library's commitment to their families.
Project Logo

DigiMed

Digimed is a patient health literacy application that simplifies complicated medical terms and helps educate patients about their condition or treatment and helps them get better. We use computer vision algorithms to process the picture of a pill bottle label and break the text down into understandable terms. Our conversations, presentations and tests/trials to people have received great feedback about the problem being addressed and the easy to use application for setting up their electronic medical cabinet. With Digimed, patients will always be informed of whats really going on in their medical treatment process.
Project Logo

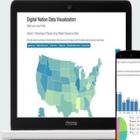
Digital Nation Data Analysis and Visualization

We believe universal information access is the first step to an egalitarian society. The team worked closely with policy makers and analysts at the federal and state level to expose insights from the Digital Nation dataset, helping them arrive at data backed solutions to provide information access for all. Digital Nation data is collated by Bureau of Census by surveying 56,000 households across America on their computer and internet usage. The results of the data analysis will accelerate the goal of expanding Broadband access and adoption in America while ensuring internet remains an engine for continued innovation and economic growth.