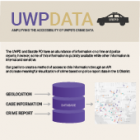
iSchool Capstone

2019

Project Logo

UWPData

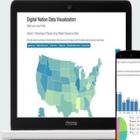
16 crimes per day occur in Seattle. This is 115% higher than the national average. Working directly with The University of Washington’s Police Department, our mission is to increase the sense of safety on campus by keeping University Residents informed of nearby crimes in real-time. The core of our project is to amplify the accessibility of UWPD’s crime data for technical users through a public API, and for non-technical users through a public visualization dashboard. Through these tools, residents will be empowered to make better decisions surround their safety.

2018

Project Logo

A Strategic Dashboard for the Virginia Beach Public Library

The Virginia Beach Public Library compiles its key data into a single spreadsheet that is then used to create strategic planning documents. This spreadsheet contains a compilation of data from the various branches and is subdivided into strategic planning categories. The Virginia Beach Public Library staff recently acquired a new business intelligence tool and requested that I try to make their data live rather than static. This would reduce time and effort in creating their periodic reports to the city of Virginia Beach. My efforts with led to the creation of a dashboard accessible via the web and mobile devices.
Project Logo

Adticipate

Successful marketing strategies can be expensive and elusive for startups running on limited personnel and budget. Mistargeted ad campaigns often result in failure, wasting time and resources. Adticipate offers startups a marketing workflow and Facebook ad campaign algorithm combined with machine learning that guarantees predictable results with minimal effort.
Project Logo

Broadband Data for Communities and States - Analyze and Visualize

Disparities in Internet access among residents of the whole nation have been a serious problem in the States for decades. Unfortunately, even though there is public broadband data available, it’s hard to make sense of it. This project focuses on utilizing millions of records of broadband and census data to better serve communities across the United State. We created two new measurements for broadband deployment performance and built interactive dashboards and infographics to visualize the huge volume of data. Want to explore the broadband data in your area? Find out at https://fayechu.github.io/NTIA_Data_Visualization/frontend/index.html
Project Logo

Classification of Advertising Network Traffic

Our capstone project aims at applying advanced machine learning techniques to identify advertisement traffic from the cellular network traffic. The idea behind classifying advertising traffic is relevant in today’s business era where digital marketing has become the predominant medium to increase outreach and connect directly with customers. Our team developed a novel approach to label & predict this advertisement traffic (accuracy ~97%), thereby paving the way for further research into identifying and blocking malicious/spam advertisements. The relevant activities we performed included getting data from network captures, data pre-processing, feature extraction, ad-labeling, applying ML algorithms and evaluating model performance.
Project Logo

Classifying Images Using Computer Vision

The digitization of art images has created new opportunities for artists, researchers, and students to explore visual arts. However, many digital art libraries are difficult to navigate. This is because they lack metadata to describe their images, which makes finding images based on their content hard. We applied computer vision techniques to a dataset of art images to create an art recommendation system.
Project Logo

Data For Criminal Justice

The Prosecuting Attorney’s Office prosecutes all felonies in King County. Their decisions are based on experience but minimal statistics. With increased complexity in crimes and rising need to analyze data from multiple law enforcement agencies, we collaborated with their Firearms Violence department and developed an infrastructure to analyze criminal data. The prosecutors got a better understanding of the trends across key metrics. Now, they can analyze bullet casings to link different incidents, extract an individual’s historical criminal involvement and work with law enforcement agencies to increase referral rate, thereby, improving the sponsor's overall data literacy.
Project Logo

DataBot

Do you love your work, but have this roadblock called “SQL” you don’t have the time to learn? Our product, DataBot, seamlessly bridges the gap between business and technology, so that you can focus on scaling new heights. DataBot leverages Machine Learning to transform natural language into SQL and presents actionable information. This empowers consultants to retrieve data on the fly, and eliminates ad hoc requests to analysts. DataBot harnesses the power of the cloud to ensure zero downtime. Slack integration ensures it can be easily deployed in an office environment. Embrace yourselves for the next disruptive technology revolution!
Project Logo

DigiMed

Digimed is a patient health literacy application that simplifies complicated medical terms and helps educate patients about their condition or treatment and helps them get better. We use computer vision algorithms to process the picture of a pill bottle label and break the text down into understandable terms. Our conversations, presentations and tests/trials to people have received great feedback about the problem being addressed and the easy to use application for setting up their electronic medical cabinet. With Digimed, patients will always be informed of whats really going on in their medical treatment process.
Project Logo

Digital Nation Data Analysis and Visualization

We believe universal information access is the first step to an egalitarian society. The team worked closely with policy makers and analysts at the federal and state level to expose insights from the Digital Nation dataset, helping them arrive at data backed solutions to provide information access for all. Digital Nation data is collated by Bureau of Census by surveying 56,000 households across America on their computer and internet usage. The results of the data analysis will accelerate the goal of expanding Broadband access and adoption in America while ensuring internet remains an engine for continued innovation and economic growth.