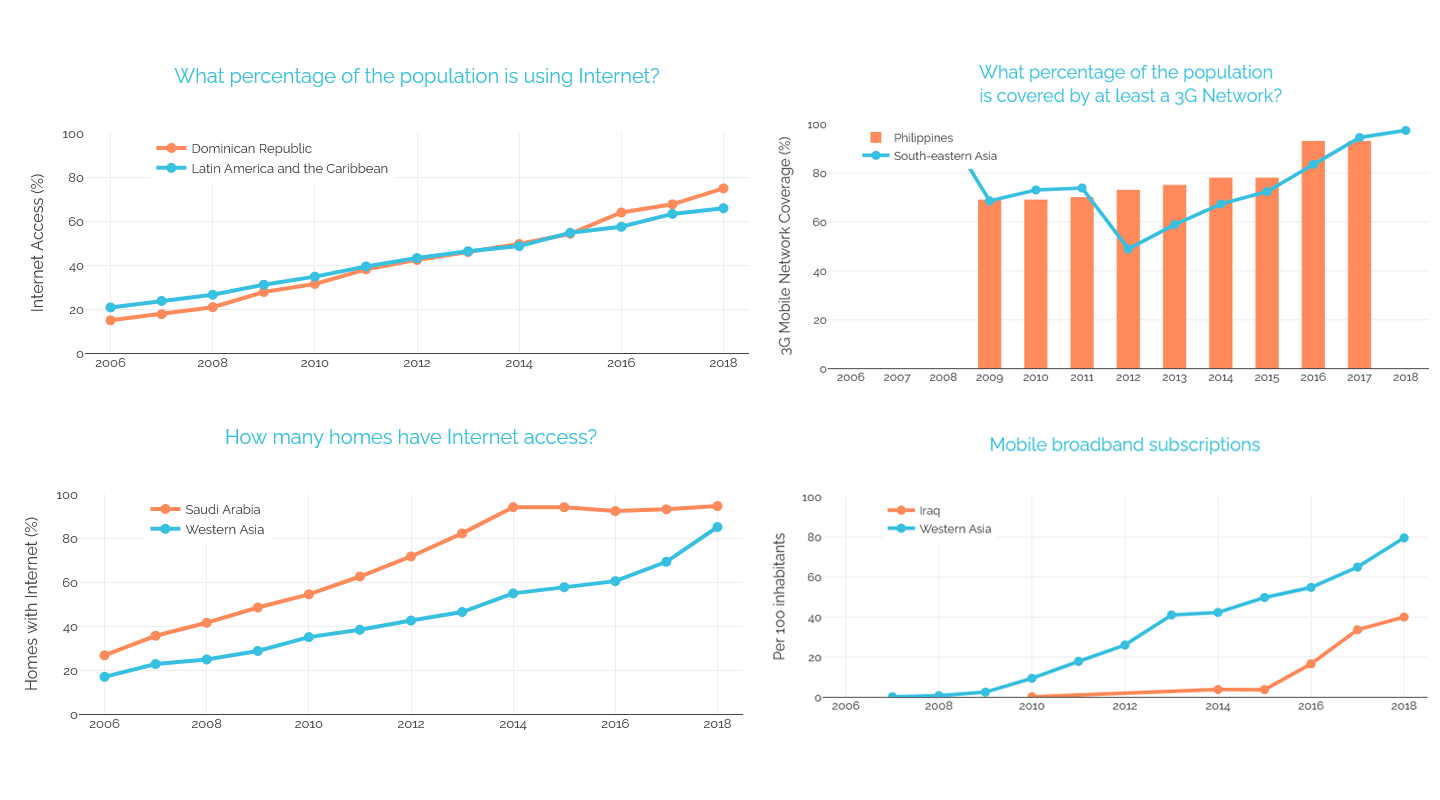
Meaningful access to information around the world can be studied at a national and regional level by exploring trends in key indicators related to Connectivity, Freedom, and Gender Equity, according to researchers at the Technology & Social Change Group (TASCHA) at the University of Washington Information School. A new set of data-visualization dashboards allows users to explore TASCHA’s research and see how each nation stacks up.
The dashboards offer visual displays that allow users to compare each country with regional averages, and they explain how the data relates to meaningful access to information. They are intended to allow researchers, social organizations, policymakers, public libraries, activists and others in the community to explore trends.

“The process of collecting and curating the data from all the different international sources was not an easy endeavor” said Maria Garrido, a principal research scientist with TASCHA. “It was time- and resource-consuming. The team was exploring ways in which we could make this database more accessible and useful to different kinds of audiences and to people with different levels of data literacy skills. Making knowledge more democratic is our first and foremost source of inspiration.”
Access to information is a key contributor to several of the Sustainable Development Goals set by the United Nations in 2015 as a “blueprint to achieve a better and more sustainable future for all” by 2030. The 17 goals include quality education, gender equality, climate action, good health and well-being, and several others for which access to information is a key contributor.
TASCHA, in partnership with the International Federation of Library Associations and Institutions (IFLA), has been tracking the world’s progress toward achieving not only access to information resources, but meaningful access. “The physical and legal availability of information – the supply side – cannot make a difference when people do not have the skills, confidence and social and cultural conditions to make it meaningful in their everyday lives,” researchers wrote in their 2019 report.
The new data visualization dashboards allow users to explore countries’ trends; identify data gaps; use the graphs and tables in reports, policy briefs or grant applications; or download the database to identify their own potential avenues for research.
The database feeding the platform was first created and curated in 2016, as a core pillar of the Development and Access to Information (DA2i) report series, produced by IFLA in partnership with TASCHA. The report, issued once every two years, includes a TASCHA-led chapter based on analysis of this database that tracks governments’ progress toward fulfilling their commitments to promote meaningful access to information. The research is funded by a grant from the Bill & Melinda Gates Foundation.
Along with Garrido, researchers Lucas Koepke, Bree Norlander, Chris Rothschild, Araba Sey and Chris Jowaisas contributed to the dashboards, as well as front- and back-end developer Daniel Rekshan and recent Master of Science in Information Management graduate Manisha Vyas.
As a research assistant, Vyas helped in designing many of the visualizations and developing the first iterations of the platform, Garrido said.
“It was wonderful to work with Manisha on this project. When she joined our team, the dashboards platform was just a skeleton. Her role was instrumental in further developing the platform,” Garrido said. “She showed great professionalism, problem-solving and collaboration skills, and had the opportunity to apply some of the knowledge from her master’s program into a practical, real-world project.”
