
PowBility: Accessibility Checker for Power BI Visualizations
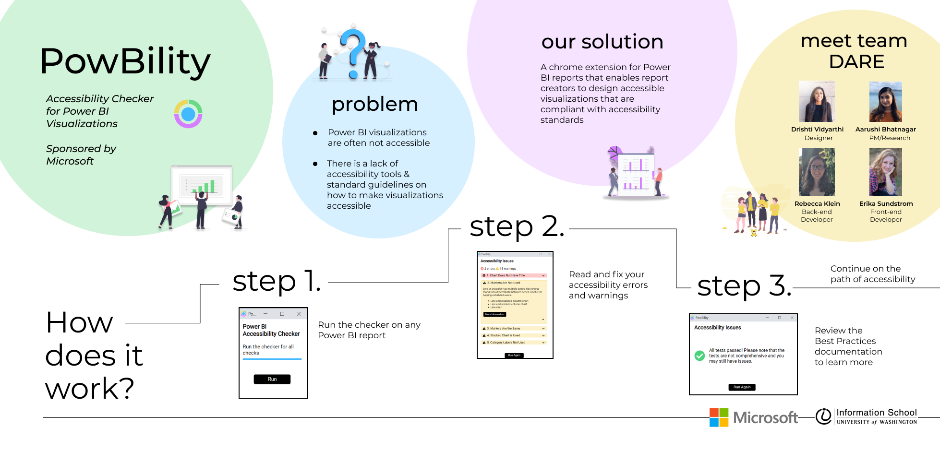
With more than 1 billion people with disabilities worldwide, we believe that accessibility is essential and should not be left as an afterthought. Data visualizations are one area where accessibility lags behind. This is especially important for Power BI, a growing platform with over 5 million subscribers. Power BI creators have difficulties building accessible reports due to a lack of accessibility tools & standard guidelines on how to make visualizations accessible. Thus, we developed PowBility: a chrome extension that enables Power BI report creators to design accessible visualizations. PowBility aims to enable everyone to utilize visualizations to their full potential.
Project sponsored by: Microsoft
Project participants:
Drishti Vidyarthi
Informatics
Aarushi Bhatnagar
Informatics
Rebecca Klein
Informatics
Erika Sundstrom
Informatics