At its core, the goal of the University of Washington EarthLab is easy enough to explain. EarthLab connects various communities, sectors and disciplines with the UW to create equitable solutions to climate change. Understanding the big picture of how the EarthLab does that work, however, and seeing how the pieces connect, is more complicated.
EarthLab wanted a way to make its work easier to understand. In particular, it wanted to be able to show how its larger network, including tribes, students, nonprofits and other academic institutions, are connected. EarthLab hopes showing the places, people and groups it’s working with will help make more connections to support its work and the work of its collaborators.
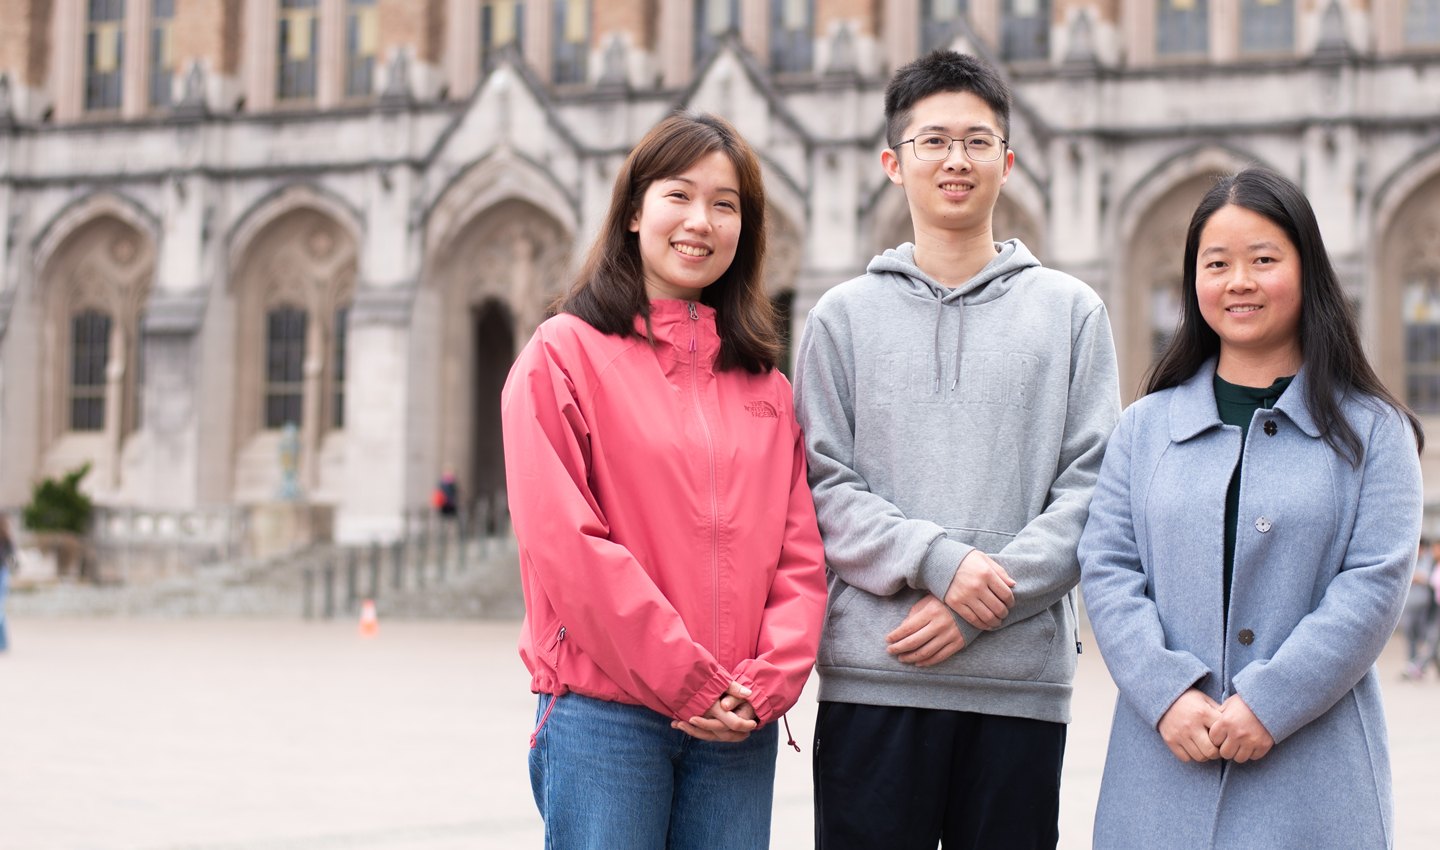
EarthLab had plenty of data, but it didn’t have a way to make that data easy to understand. To help achieve that goal, the organization is working with Information School Capstone students (pictured, from left) Xuan Nie, Jiahe Huang and Pengyan Sun, who are using data visualization to help show what EarthLab does and how its work connects with its many collaborators.
Huang, Nie and Sun are all Master of Library and Information Science students graduating in June. They were drawn to the project because it would let them use the data visualization skills they’ve learned in the MLIS program, and they all have an interest in environmental issues.
“Our job is to visualize the data,” Sun said. “It’s a visual way to see the impact of EarthLab’s connections.”
Mónica Limón Conte, the community partnerships lead at EarthLab, says the visualization is one of the ways the institute can make sure it’s staying accountable to its collaborators and that it is making progress toward the goals set out in its strategic plan.
Constance McBarron, EarthLab’s communications and engagement manager, hopes the network snapshot makes the organization's work clearer and more effective while promoting transparency.
“We hope that by publishing this info that folks can start to make those connections. Data is so protected, especially at the university, and we are trying to do away with those old systems,” she said. “We want to present who we are authentically in a way that folks can understand. We want folks to be able to see themselves — and if not, be able to rectify that.”
The students all had experience in data visualization, but they hadn’t yet used Tableau, a data visualization and data analysis tool. They chose that program because it’s user-friendly for non-experts, which will make the project easier to carry on in the future.
“It was very exciting to get familiar with this new software,” Nie said. “We were also happy to use real data to get familiar with these skills and contribute something to the program.”
While the data they work with in class has generally been cleaned up, the data from EarthLab took more finesse. The team had to work with their EarthLab sponsors to interpret the information while making sure to consider important concerns like privacy.
“We told them how to clean up the data, how to make it more machine readable so that we can use it in Tableau,” Huang said. “And Mónica now has a better sense of how to use Tableau and how to use data visualization.”
Their time at the iSchool gave them the technical skills they needed for this work, but also a solid background in diversity, equity and inclusion. Learning about Indigenous knowledge systems was particularly helpful, because tribes are such important collaborators for EarthLab, and it’s vital to it to be good stewards of tribe’s data.
“Our program really emphasizes DEI; every course has an element of DEI, which lets us look at all of this through that lens,” Sun said.
The students agree their Capstone experiences will be helpful as they move on after the iSchool.
“The biggest thing Capstone has helped me with is developing my communication skills and getting a feel for visualization at work. … The second thing is that I learned more skills and was able to better integrate my course knowledge with real-world situations,” Huang said. “Capstone has been very helpful in enriching our experience, skills and resumes.”
After graduation, Huang will be working at an internet company in data management and visualization, Sun will work in an academic library, and Nie is applying for Ph.D. programs.
“They’ve been such critical thinkers and problem solvers,” Limón Conte said. “They have been so willing to expand their knowledge in data visualization and they have supported me by pushing me, too.”
The Capstone team also hopes that the work they have done will be useful for EarthLab in the future as well. They created a guidebook to help EarthLab update the data visualizations as new data comes in. EarthLab hopes to have the visualization up on its website later this year, and to continue updating it in the years to come.
“Understanding information is empowering,” Limón Conte said. “And we can only do that with a way to communicate. And language is not always the best way. It’s why we were as intentional as possible with this project. The team helped this be accessible and sustainable.”
