As a practicing physician, Ari Pollack wants to spend less time searching for information and more time focusing on his patients’ needs. And he’s not alone; data show that Electronic Health Records, or EHRs, are a constant source of frustration to physicians.
“I always thought there was a better mousetrap to build,” Pollack said.
The Information School Master of Science in Information Management alumnus is working on one. He and iSchool Professor Wanda Pratt teamed up on a study of some alternative ways to present data to physicians using visualizations. The prestigious Journal of the American Medical Association published their findings in a recent paper.
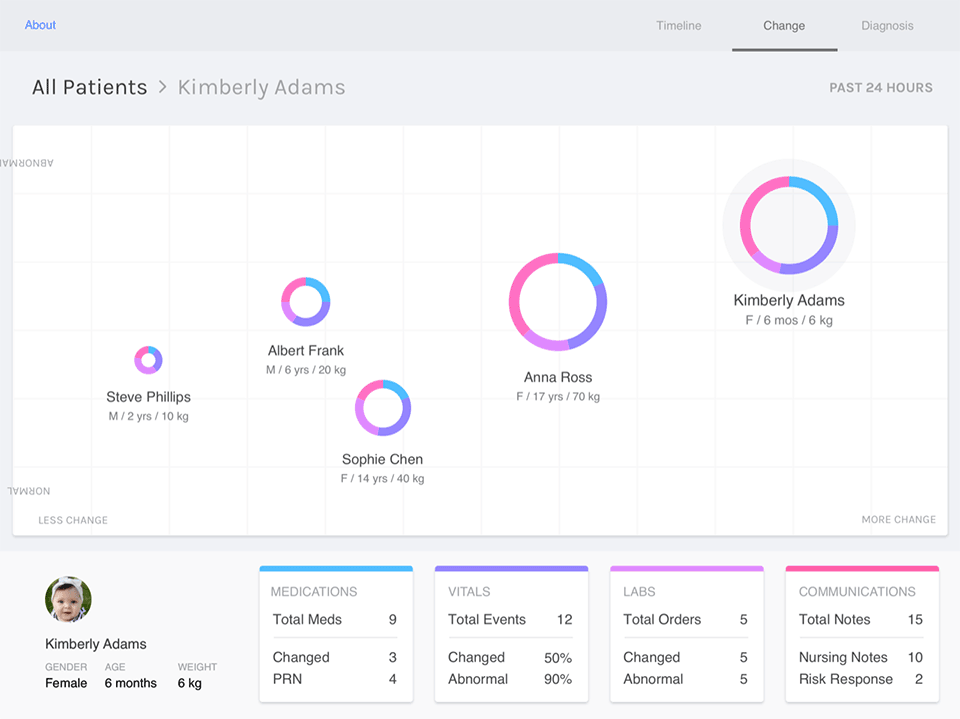
In the study, Pollack and Pratt showed data to doctors at Seattle Children’s Hospital using three visualization techniques and then tested the effect of each technique on their cognitive load – the mental burden they experienced studying patient records. Where traditional EHRs would require a physician to search through a patient’s record and remember key points, the visualizations highlighted lab tests and other results that would be most likely to worry doctors.
“So now we’ve switched the burden of information seeking from the physicians to the computer,” Pollack said. “The computer finds those elements and prioritizes them for physicians, so physicians can use their time to think about what it means instead of searching for them in the first place.”
In the study, doctors embraced a tool that was radically different from what they were used to working with, Pollack said. An empirical test of their cognitive load showed that it improved their ability to make decisions.
“Despite a dramatic difference and a significant way of reorganizing information, clinicians still liked it the best, and it still supported their decision-making better than any other tools,” Pollack said.
"I decided to go to the iSchool because it was an opportunity to see how people outside of health care solve big information problems."
To avoid any issues with patient privacy, Pollack and Pratt used synthetic data. Pollack crafted the data to present a similar level of complexity in each of three data visualization dashboards. The researchers presented the visualizations to 29 physicians at the Seattle Children’s Research Institute, which funded the study. One of the visualizations, which highlighted how the patient’s condition had changed over time, was the clear preference of most of the study participants. While this study didn’t compare how the visualizations performed compared with existing EHRs, anecdotal results were encouraging, the researchers said.
“Their comments were pretty dramatically positive,” Pratt said.
While Pollack offers a physician’s perspective, much of Pratt’s research focuses on the needs of patients. She researches information challenges facing patients and designs technology to improve their health outcomes. She’s hopeful that these visualization tools could be helpful to patients in multiple ways – not only by improving their care, but by communicating it better.
“I’m more interested in how this affects patient care,” she said. “Can patients see some information along these lines? Can they understand their own health situation and how things are changing?”
Pratt leads the iSchool’s iMed research group and counts Pollack as a valuable research partner. As a physician who specializes in treating children with kidney ailments at Seattle Children’s, Pollack brings a clinical perspective to the group’s research and credibility with key partners when undertaking a study such as this one.
“It’s a lot easier for me to get physician involvement in our studies as a peer than for someone who’s not a peer or a colleague,” Pollack said. “Just me being a member of the club makes it a lot easier for us to get that physician opinion and perspective that is so important.”
Pollack also knows that his colleagues would welcome a better alternative to the existing EHRs. A study published by the Mayo Clinic in 2019 linked poor EHR usability to a high rate of job frustration and burnout among physicians.
Early in his medical career, Pollack developed an interest in building better technology. That’s what brought him to the iSchool to pursue an MSIM degree, which he completed in 2014.
“I decided to go to the iSchool because it was an opportunity to see how people outside of health care solve big information problems,” he said.
As for this information problem, there’s plenty more work to do. Pollack and Pratt are working on follow-up papers that show how the visualizations compare to standard EHRs. The next step is to develop algorithms that will accurately reflect patients’ conditions on the data visualizations. While it’s just a start, it’s a promising one for physicians like Pollack.
“I feel like these tools generally make us work too hard and put up too many barriers to good patient care and it really needs to change,” he said.